设置报表
OpenERP有两种不一样的报表类型:
- 统计报表:这些计算数据,往往在列表或图表的表单中显示。这些报告是动态的,可以通过客户端界面浏览包括这些数字的数据。
- 报表文件:它们被用来打印系统文档。结果通常是屏幕上生成一个PDF。此外,OpenERP使您在OpenOffice.org中打开这些报表进行编辑, 在你发送他们给你客户之前,可以做任何你需要的变动。 因为 OpenERP 引擎的强大,这两种类型的报表无须任何开发就能建立和修 改,并能在OpenERP客户端界面或者OpenOffice中 直接完成。
因为 OpenERP 引擎的强大,这两种类型的报表无须任何开发就能建立和修改,并能在OpenERP客户端界面或者OpenOffice中 直接完成。
管理统计报表
许多报表已经在OpenERP中预先设置好了。你能在每个主菜单项目下面的报表子菜单找到他们。
新报表建模
OpenERP gives you the possibility of developing your own analyses to meet your specific needs. To
define a new analysis of the system’s data, you should install the module base_report_creator.
You can do so by using the Reconfigure wizard and installing Advanced Reporting.
Then as you configure the reporting tools, select Query Builder for installation.
This enables you to create complex queries on the database, in a simple and visual way.
OpenERP提供自行开发报表的功能,以满足你自己的特殊需要。要定义一个新的系统数据的分析,你
需要安装一个模块 base_report_creator 。你能使用 设置→设置→设置向导→设置向导,
选择 “OpenERP 报表设计器安装程序”,点击“作为待办事项”→ 启动,然后把表设计器另存为 到一个目录中,待用。
译注:下面的内容在6.1没了
启动向导并安装 Advanced Reporting来做。然后你设置报表工具,选择安装Query Builder。这使得你能在一个简易和可视 化的方案中建立复杂的数据库查询。
一旦模块安装完成,要创建一个新的报表,使用菜单 。
Give a Report Name to your new report and select the objects that you are going to analyse. For example, select the project.vs.hours object (you have to install Project Management for this).
给出一个新报表一个 报表名称,然后选择一个你要分析的对象。例如 选择下面三个对象:“Partner”、“Sale Order”、“Sale Order line”。 然后再打开第二个选项卡[视图参数],选择你报表所需的视图。在第一个视图选择 树,在第二个视图选择图。你能选择图显示的类型 使用 图形视图字 段。您也可以选择日历作为视图,如果你要添加日期字段在您的报告中。
Then turn to the second tab View parameters to select the views that you want in your
report. Select Tree in the First View and Graph in the Second
View. You can choose the type of graph displayed using the Graph View fields. You could
also select Calendar as a view if you were going to add a date field to your
report.
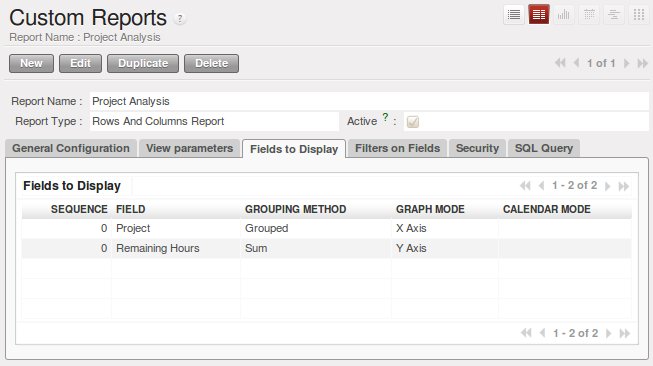
Fields selected for the project analysis
In the third tab Fields to Display you must indicate which of the fields in the list you want to be shown in your report. Complete the screen along the lines of the figure above.
The Sequence field gives the order of the fields displayed.
Field, the second column, enables you to select a field from any of the objects you selected in the first tab.
Grouping Method, the third column lets you to determine the grouping operation that is to be applied to this field:
- Grouped : Enables you to group document entries with the same value in this field.
- Sum : Gives the sum of values in this field.
- Minimum : Gives the minimum of all the values that appear in this field.
- Maximum : Gives the maximum of all the values that appear in this field.
- Average : Gives the arithmetic average of all the values in this field.
- Count : Gives the count of all the values in this field.
Graph Mode, the fourth column, determines if the field will appear in the graph view and, if so, on which axis (X or Y).
Calendar Mode, the fifth column, enables you to specify if the field can be the basis of a calendar view.
In the fourth tab Filters on Fields, you can add filters on all the fields of the selected objects. To do that, use the button Add filter at the top of this tab. For the moment, do not add a filter.
You can now Save the report you defined. Click on the Open Report button to the right of the form on the General Configuration tab to get the requested analysis.
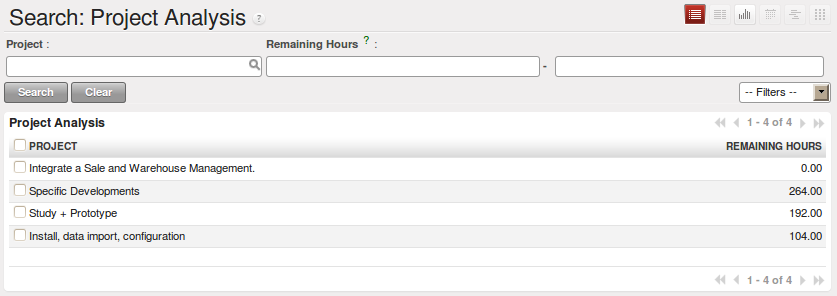
按项目分组的任务列表统计
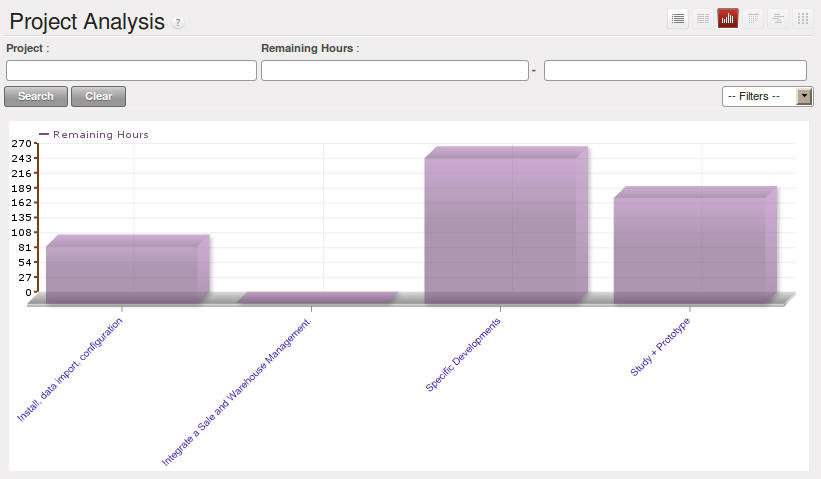
按项目分组的任务图形统计
设置控制台
控制台可以选择之前定义的报表,并且可指定任何一个报表在控制台的位置.
就像在报表中的字段,序列字段决定了在控制台上出现的顺序
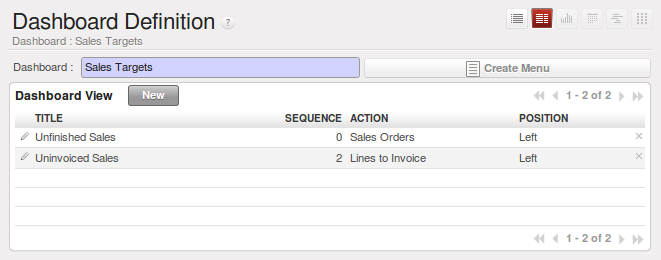
定义一个新的仪表板
一旦控制台被定义,通过菜单 ,你能用 创建菜单 按键在菜单系统的任何位 置为你的控制板建立一个菜单项。
用 OpenOffice.org管理文档模版
要在openERP里设置可以打印的文档,将使用前面一节中 另存为的 插件。设置
Tip
OpenOffice.org Writer 插件
你能使用 OpenOffice.org Writer插件 只需花费几分钟就能 建立你自己的报表。这个工具可以让你的 团队工作效率得到巨大的提升。使用它,你能为你公司的所有文档建立模版,减少创建和填入数据和客 户文档的工作。
这系统是简单和强大的,因为它给你所有OpenOffice.org Writer中提供的排版能力以及OpenERP提供的数据和计算的好处。 你可以直接从OpenOffice.org创建和修改报表,然后在OpenERP中使用
Note
OpenOffice.org的独立性
OpenOffice.org只是用来产生新的文档模版。设置员是安装它的唯一的人。
一旦文档模版被定义,用户就不需要再带入到平常的工作中。他们能够选 择Microsoft Office或者OpenOffice.org。
OpenOffice.org插件使你能搜索OpenERP的字段,集成他们到你的文档模版。你可以使用表或章节循 环数据,你可也可以在一张订单中添加多行明细,例如:
一旦新报表被定义,他就直接展示在系统用户的OpenERP客户端
There are two modes of using reports:
- 用选择的记录数据生成报表产生一个PDF文档(比如开票)
- 用选择的记录数据生成报表,在OpenOffice.org中打开进行修改。这让你在发送给客户前能够修改这个文档(比如报价单)
个性化的报表存储在OpenERP数据库,每个有权使用数据库的人无须安装OpenOffice.org在他们自己的计算机上就能访问。文档 的修改被保存在单个数据库
安装OpenOffice.org模块
使用报表设计器之前,你要安装两个部件:
- 模块:mod:base_report_designer
- OpenERP的OpenOffice扩展,使用前面一节中 另存为的 插件:设置 openerp_report_designer.zip文件 (译注:base_report_designer模块的安装目录的plugin子目录存有此文件)。
安装模块 base_report_designer 就像其它所有OpenERP模块一样。
要安装OpenERP的OpenOffice扩展,使用前面一节中 另存为的 插件:设置 openerp_report_designer.zip文件 (译注:base_report_designer模块的安装目录的plugin子目录存有此文件)。检测OpenOffice.org 已经正确安 装在你的计算机上面,并且你有管理员权限用于安装。
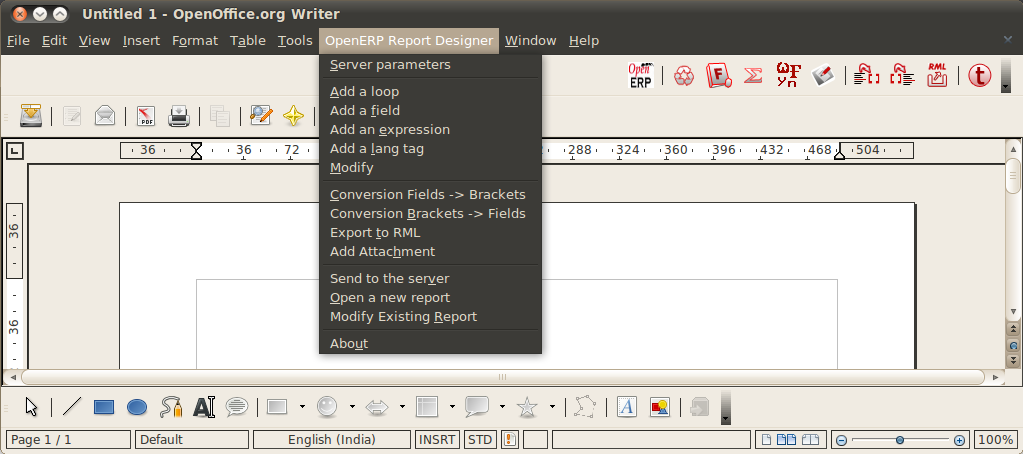
OpenOffice.org Writer 中的 “OpenERP Report”菜单
启动 OpenOffice.org Writer,选择菜单 打开扩展管理 对话框, 搜索openerp_report_designer.zip文件安装,然后关闭 程序,重启Writer,一个新的菜单出现在菜单条上
连接 OpenOffice.org 到 OpenERP
在 OpenOffice.org Writer 顶部菜单 选择 OpenERP Report Designer → Server parameters 。 你能输入到OpenERP server 的连接参数。你 必须选择一个 你已经安装了“采购”模块 的数据库。如果成功连接,一条信息会出现。
修改报表
报表编辑器能够做到:
- 修改一个已经存在的报表,然后替换数据库之前的老版本,
- 重新选择对象并创建新报表.
要修改一个已经存在的报表,选择 “OpenERP Report Designer → Modify Existing Report”。 Choose the report Purchase Order - Request for Quotation in the Modify Existing Report dialog box, and then click Open Report.
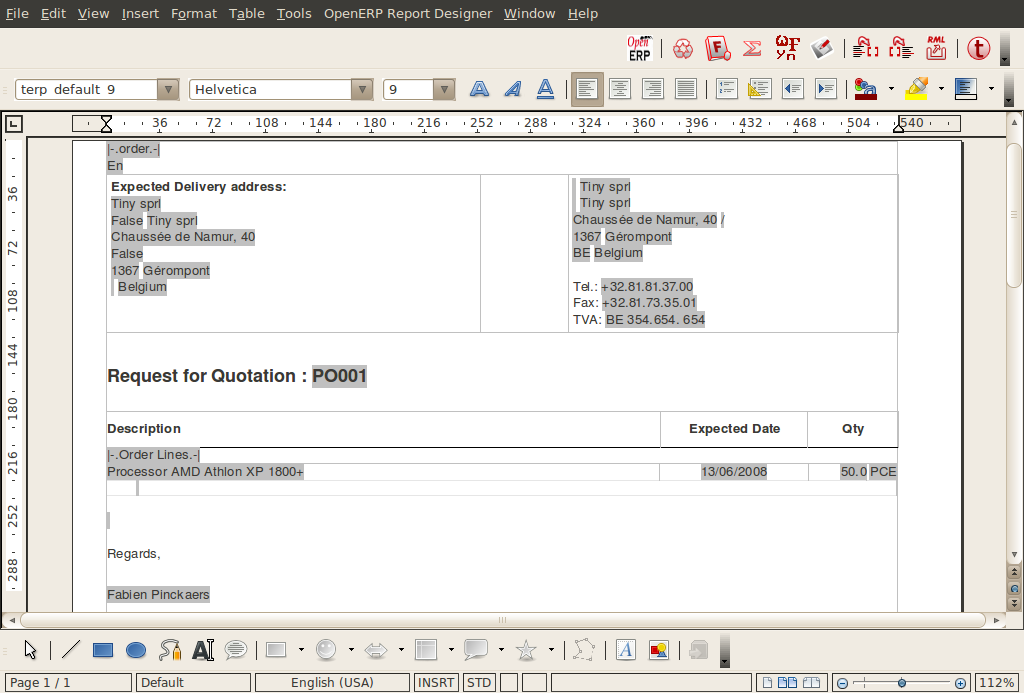
修改文档模板
OpenOffice.org 然后为你打开报表进入编辑模式,你能使用OpenOffice.org Writer的标准字处理功能修改它。
在你已经设置相应的言语模块的情况,一量英文版本被修改后,当你通过客户端界面使用它的时候,它将被OpenERP的翻译系统翻 译。这样你只需要修改模版一次,即使你的系统使用了其它语言,如本章前面所述,如果你添加了字段,你将需要增加翻译, 或者更改已经存在的。
Tip
旧的报表
旧报表可能还没有全部转换为新的由OpenERP支持的形式。旧格式的数据表达式显示在双括号内, 并且不在OpenOffice.org字段内
You can transform an old report format to the new format from the OpenOffice.org menu .
从 OpenOffice.org 中的 OpenERP 工具栏,可能是::
- connect to the OpenERP server: 提供链接参数.
- add a loop: 选择相关字段,其中包括了建议对象可用的字段,例如 订单行。当它被打印时,对订单的每一行循环执行。
- 循环能被放进表格(行将被重复)或者放进OpenOffice.org部分。
- add a field: 从整个OpenERP数据库选择对象及特定的字段。.
- add an expression:输入一个python语言表达式 从选择对象的任意字段计算数值。
Tip
Python 表达式
使用 表达式按纽,你能输入Python语言的表达式,这些表达式能使用所有对象的字段用于计算。
例如,如果你要在一个订单做做个报表,你能使用下列表达式:
‘%.2f’ % (amount_total * 0.9,)
这个列子中amount_total是order对象的一个字段。结果将是订单汇总的90%,格式化为2位小数。
你能在Openerp里面测试结果,使用菜单“采购→采购管理→询价单”
建立新报表
通常模版由循环(比如选中的订单列表)和来自对象的可循环字段组成。按你的要求格式化,然后保存为模版
已有的报表模版构成了丰富的示例。 你能开始通过增加循环和几个字段来创建一个最小的模版。
当报表已经被建立,发送到服务器,点击OpenERP Report Designer → Send to the server,带来Send To Server对话框。 一个报表的技术名称被指定为默认,使其出现在其它销售订单报表的旁边。在Report Name字段将模版改名为Sale Order New, 选中 Corporate Header 复选框,然后 点击 Send Report to Server完成。
发布到服务器,你能指定打印方式,当用户打印文档时,是否要openerp 产生一个PDF,或者在打印前,打开文档到 OpenOffice.org Writer中进行编辑。要做到这点,在字段Select Rpt. Type中选择PDF , OpenOffice (SXW) 或者 HTML。
创建报表的公用页眉
当保存新报表和修改完报表,将会有一个选项,让你选择一个页眉。这个页眉是个模版,每个数据库都会一个包含指定 内容的标准页眉及页脚。
这个模块通过改变公司信息进行自定义 ,通过菜单 设置→公司→公司。你能从列表选择你的合作伙伴公司 ,然后在一般信息 选项卡里面编辑报表页眉、报表页脚1、报表页脚2字段。如果你的公司有标记,你能让他显示在所有的报表,你能用 logo 字 段加上它。你能通过编辑 页眉/页脚,和内部页眉/页脚 选项卡的XML代码改变页眉/页脚的外观。