分析销售绩效
组织销售漏斗的复核
Through the Opportunities Analysis, , you can keep track of your sales funnel. The analysis report gives you instant access to your opportunities displaying information such as expected revenue, planned cost, missed deadlines or the number of interactions per opportunity. This report is perfect for the Sales Manager to periodically review the sales pipeline with the salesteams concerned.
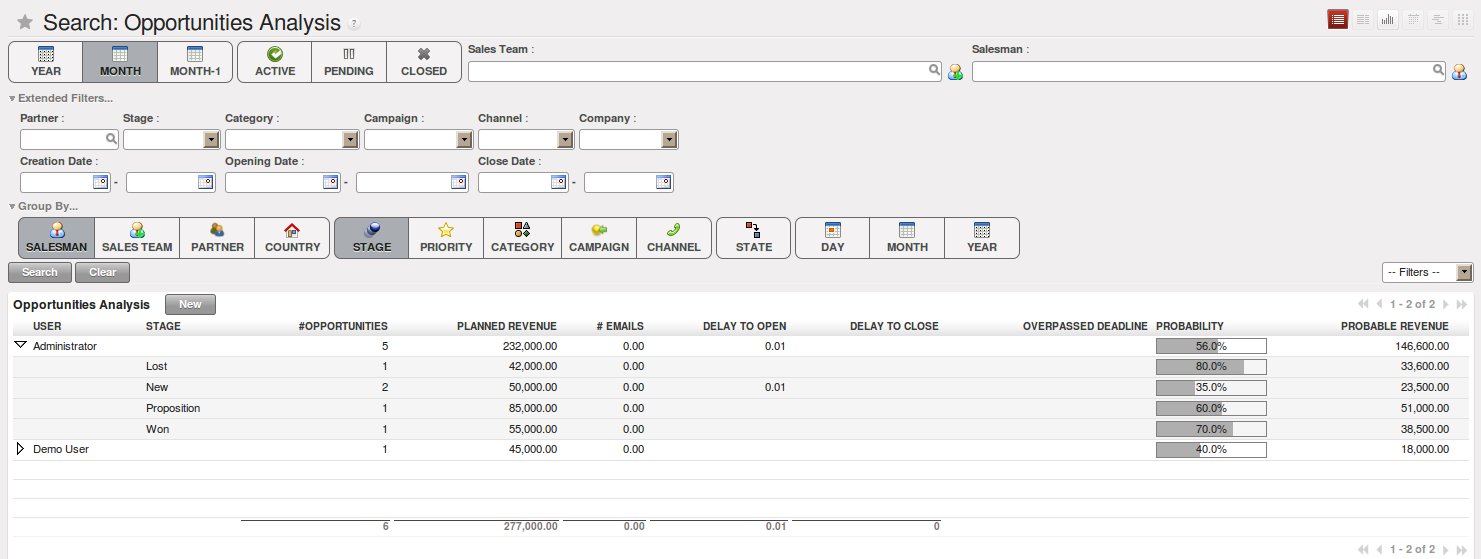
Sales Funnel Review
The powerful Advanced Search View allows you to customize your analysis reports by using Extended Filters and Group by features.
With Extended filters, you can select specific options to filter your opportunities. For example, when you select a partner here, only opportunities related to that specific partner will be displayed.
You can also filter the information of an opportunity according to the Group by features. Suppose you want to analyse your opportunities by campaign and by salesman. When you open the Opportunities Analysis screen, you will notice that the opportunities are by default grouped by salesman (see Salesman button in the Group by area).
Since you want to group by Campaign first, click the Salesman button to unselect it. Just click the Campaign button, then click Salesman to get the report you want.
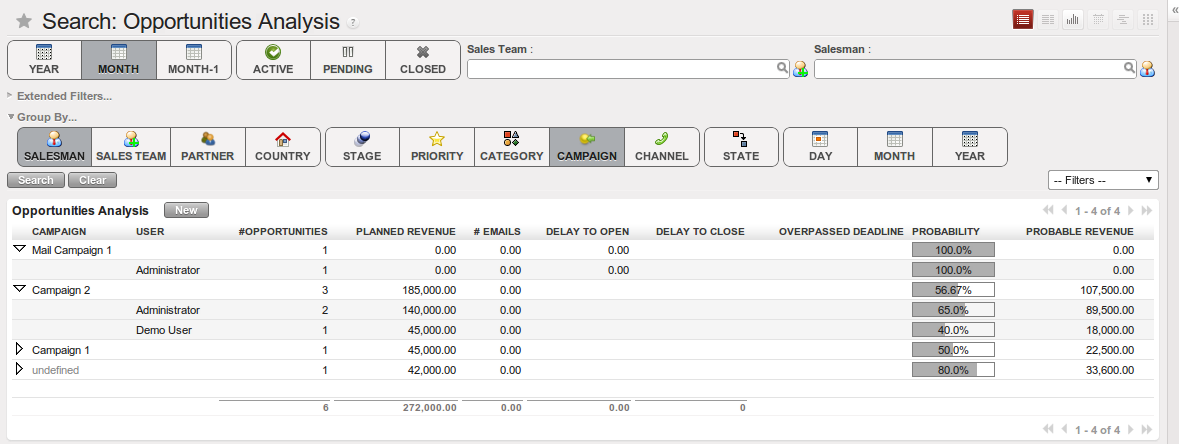
Opportunities Analysis
Some examples of how you could use the Opportunities Analysis report to analyse your opportunities in various ways.
- Customers with Open Opportunities:
Group by Partner, click the Active button to provide a list with the customer names and the number of draft / open opportunities.
- Closed Opportunities:
Click the Closed button, then group by State, then by Stage to display a list of closed opportunities divided by stage (lost and won).
- Opportunity Sources:
The number of opportunities can be displayed by closing date and sales stage, including expected revenue. Select only the Closed opportunities, group by Date button, then by Stage to obtain this view.
- Opportunity Pipeline:
To get an idea of what your salesman’s pipeline is like (or sales team), including the expected sales volume, click the Active button and group by Salesman (or Sales Team).
- Opportunities by Category:
Click the Graph button in the Opportunities screen to display the report as a Graph.
Tip
Graph
You can also display the Opportunities Analysis screen as a graph.
销售预测和销售仪表板
OpenERP dashboards are dynamic and allow you to edit or drill-down. Dashboards may be composed of several view types, such as List, Form, Graph view.
When you click the Sales button in the web version (to open the business application, so in the top bar), automatically the Sales Dashboard will appear. You can also access this dashboard from the . This dashboard gives you more information about your own sales activities, such as your Open Opportunities and your Quotations. This dashboard is prefiltered according to the OpenERP user who opens it. Each user can also choose a dashboard that will be opened when he starts OpenERP.
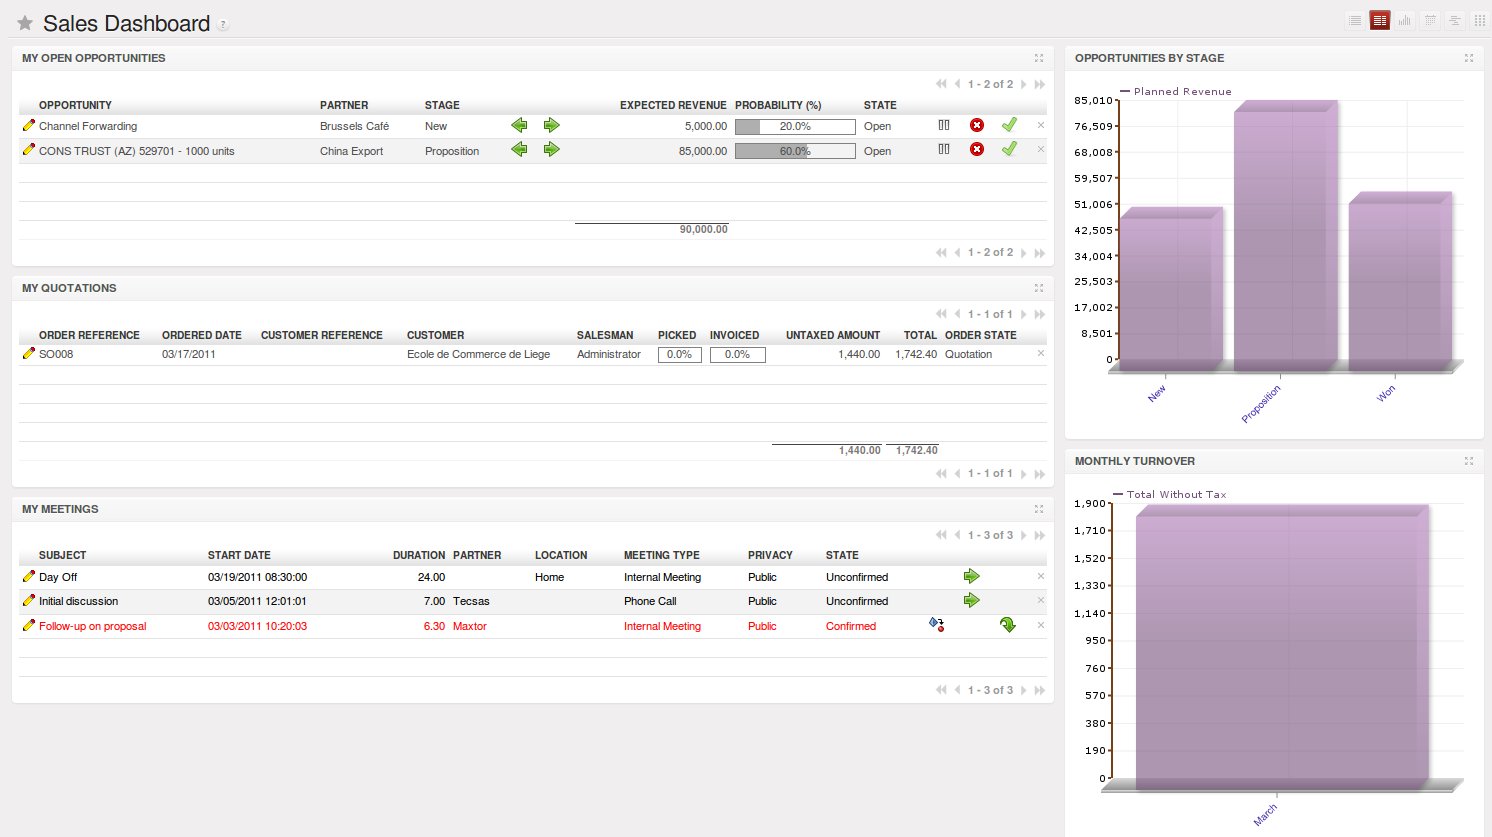
Sales Dashboard
The Sales Manager Dashboard is a powerful tool to have an overview of quotations, sales by month, sales per customer, per salesman or per product in the last 90 days.
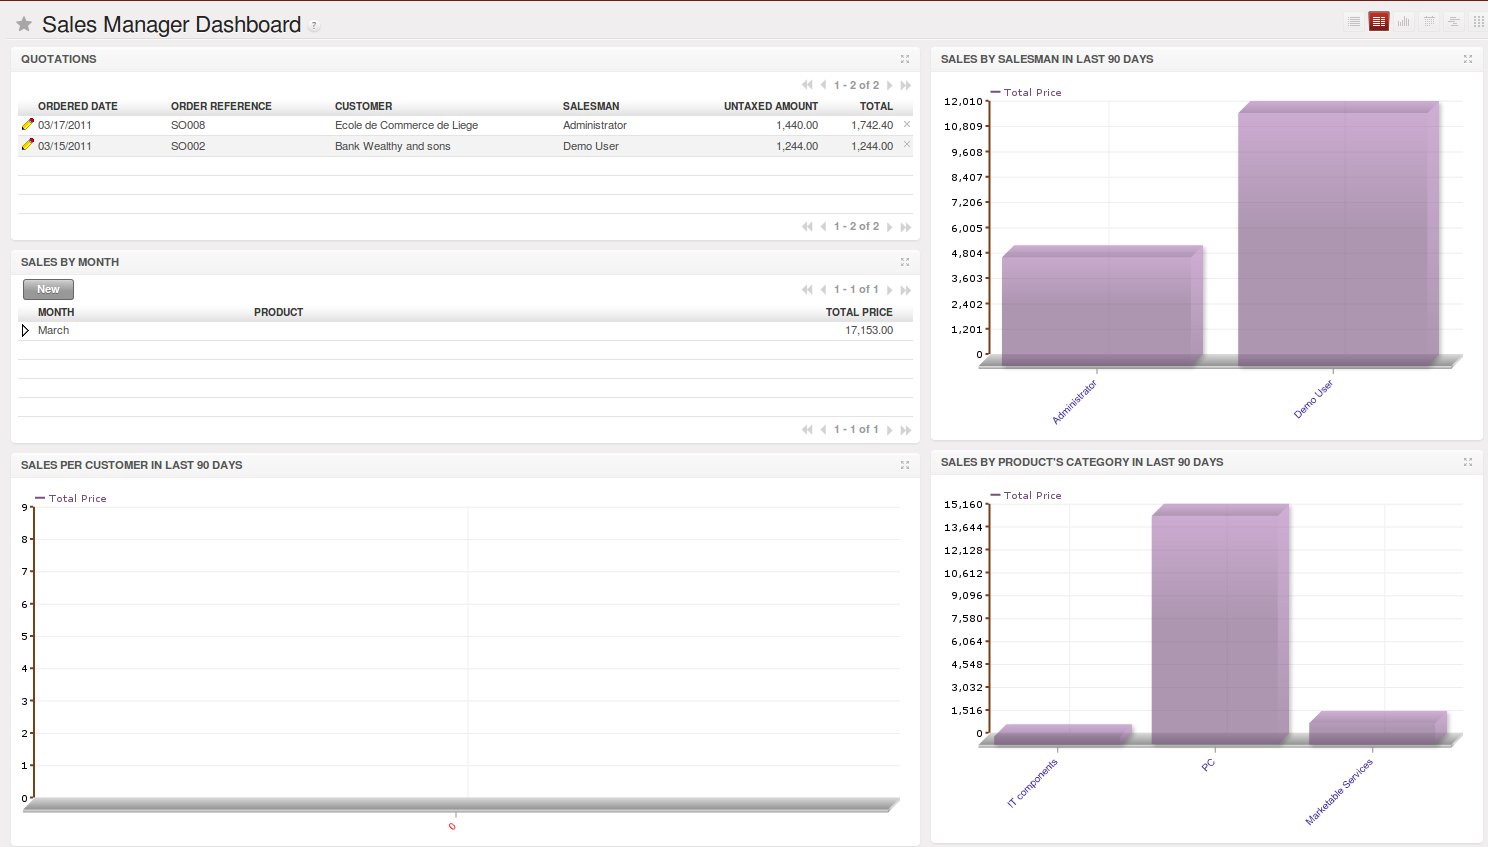
Sales Manager Dashboard
The Statistics Dashboard shows the Opportunities by Category and by Stage, as well as the planned revenue per stage and user. Clicking one of the stages in the graph will allow you to drill down to the details of such an opportunity. So no need to go through several screens to find what you need.
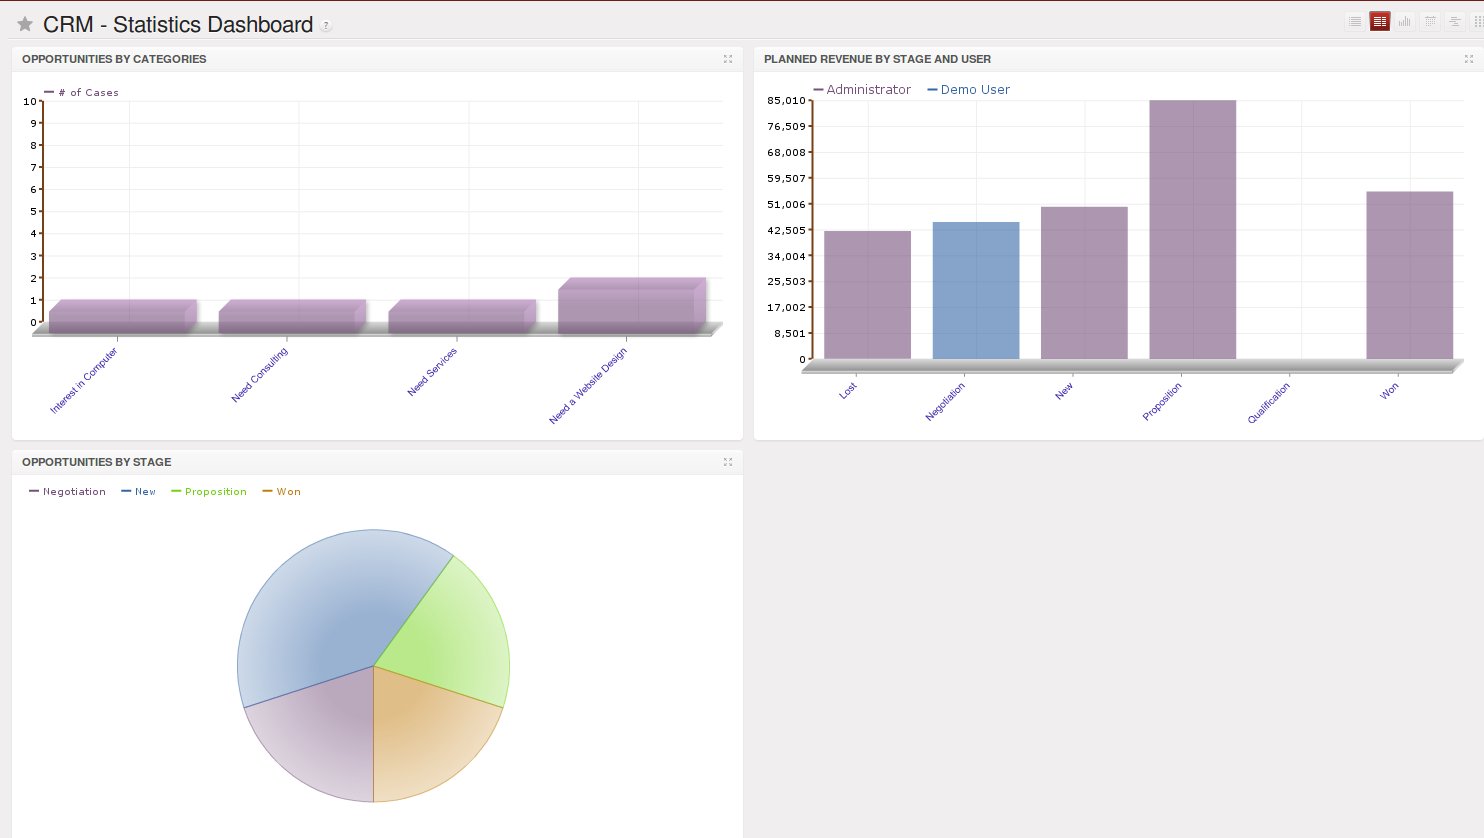
Statistics Dashboard